
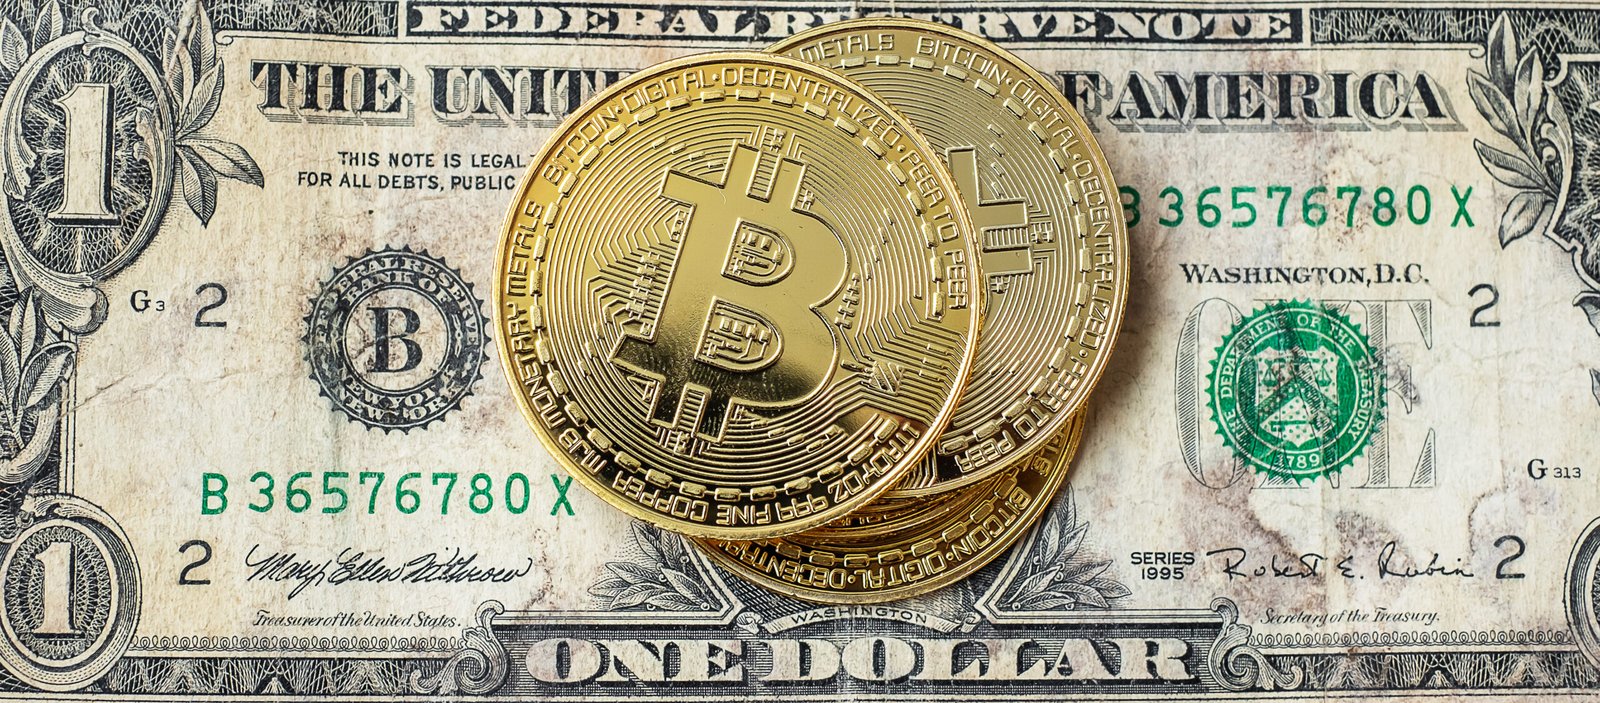
Bitcoin’s Path to $40,000: Understanding the Current Crypto Market Downturn
The cryptocurrency market is experiencing significant turbulence, with Bitcoin falling from its peak of $125,000 to approximately $76,000, raising questions about whether further declines are ahead. Market analysts are examining whether this represents a standard bear market cycle or something different, with some projections suggesting Bitcoin could fall to $40,000 or even test the 200-week moving average around $58,000 by late 2026.
Understanding the current market dynamics requires examining both technical patterns from previous cycles and the fundamental factors driving price action, including Federal Reserve policy, market liquidity conditions, and the broader macroeconomic environment. While some investors panic during these corrections, historical precedent suggests these periods often represent accumulation opportunities before the next bull market phase.
Historical Context: Bitcoin Bear Markets Follow Predictable Patterns
Bitcoin bear markets typically last between 12 and 18 months, and these patterns are well-documented technical features of cryptocurrency market cycles. From Bitcoin’s peak of $125,000 down to the current level around $76,000, technical analysis suggests the possibility of further declines to $40,000. The critical question is whether this decline happens rapidly through cascading liquidations and forced selling, or gradually over the next six to eight months.
The current market has experienced four consecutive months of declining prices, potentially entering a fifth consecutive red month. This represents the most sustained suppression since the bear market of 2018, which saw six consecutive months of complete cryptocurrency market decline. Historical patterns suggest that if this follows a standard bear market trajectory, which technically began when Bitcoin dropped below the 50-week moving average, the market could bottom at the 200-week moving average.
Based on historical cycles, Bitcoin prices typically reach their cycle low approximately 8 to 12 months after establishing an all-time high. If the $125,000 peak represents the cycle top, a standard bear market would suggest bottoming by October or November 2026 at the 200-week moving average, which currently sits around $58,000. This pattern occurred in 2023 when Bitcoin briefly dipped below this level, in 2020 when it tested this support, and again in 2018 during that cycle’s bear market.
Current Support Levels and Market Structure
Despite the significant decline from all-time highs, Bitcoin has found support at levels that have held significance over multiple years. The current price represents approximately the same level Bitcoin reached on “Liberation Day” (referring to a specific political event) and the same level Bitcoin rallied to on the day of the most recent Bitcoin halving event before cooling down. This suggests multi-year support at current levels.
From a fundamental perspective, the cryptocurrency market is arguably much stronger today than it was a year ago or multiple years ago. The appointment of a new Securities and Exchange Commission (SEC) chair who is perceived as more favorable to cryptocurrency, a new Commodity Futures Trading Commission (CFTC) chair, and the passage of legislation like the Genius Act have all improved the regulatory environment for digital assets in the United States.
This creates an interesting disconnect: fundamentally, today represents a better entry point than years ago when Bitcoin traded at similar prices, yet the market hasn’t fully recognized or priced in these improved conditions. This divergence between fundamental improvements and price action suggests the market is being driven by factors beyond cryptocurrency-specific developments.
Tom Lee’s Analysis: Gold and Silver Creating a “Vortex”
Prominent market analyst Tom Lee has offered an explanation for why the cryptocurrency market has performed worse than expected despite improving fundamentals. According to Lee, the crypto industry deleveraged significantly in October, reducing the amount of borrowed money in the system. When investors use less leverage, price movements tend to be more subdued in both directions.
Simultaneously, gold and silver have performed exceptionally well, particularly at the start of the year. This strong performance in precious metals created what Lee describes as FOMO (fear of missing out) that acted like a “vortex sucking all risk appetite towards the precious metals trade.” In other words, investors who might otherwise allocate capital to cryptocurrency have been rotating into gold and silver instead, drawn by the momentum in those markets.
This has caused cryptocurrency to suffer on a price basis despite solid fundamentals—a contrast that often occurs in markets where short-term price action diverges from longer-term fundamental value. Lee suggests that the broader economy remains in good shape, and much of the current turmoil stems from uncertainty about Washington’s policy direction, including potential “picking winners and losers” through regulatory and policy decisions.
Lee also notes that the appointment of a new Federal Reserve chair candidate has contributed to market uncertainty. However, he views the recent pause or correction in gold and silver as potentially positive for cryptocurrency, as it may allow risk appetite to rotate back toward digital assets.
The Federal Reserve Balance Sheet Debate
A major narrative driving current asset price weakness centers on the Federal Reserve’s balance sheet and the views of Kevin Warsh, who has been mentioned as a potential future Fed chair. Warsh has stated his belief that the Fed’s balance sheet is “trillions larger than it needs to be” and has advocated for shrinking it significantly. This stance has caused concern among investors in Bitcoin, gold, silver, and other assets that tend to benefit from monetary expansion.
The Federal Reserve’s balance sheet represents the assets the Fed holds, primarily Treasury securities and mortgage-backed securities purchased through various quantitative easing programs. When the Fed’s balance sheet expands, meaning the Fed buys more assets, it injects liquidity into the financial system, and historically this has correlated with rising prices for hard assets like Bitcoin, gold, and silver. Conversely, when the Fed shrinks its balance sheet by selling assets or letting them mature without replacement (quantitative tightening), it removes liquidity from the system, which can pressure asset prices.
Warsh has made his position clear, stating in interviews that he believes the Fed’s balance sheet should be dramatically smaller. He explained that when he first worked at the Fed, the balance sheet was approximately $880 billion and included various foreign currencies needed for the Fed’s operational functions, managing Treasury markets and serving as a counterparty to other central banks. While acknowledging the economy has grown since then, Warsh argues that the current balance sheet of approximately $7 trillion is “trillions larger than it needs to be.”
According to Warsh, the Fed is now participating in almost every banking market almost daily, and the world has come to rely on the central bank’s massive footprint. He believes this oversized presence creates problems both politically and economically. Warsh advocates for a Fed balance sheet that is “as riskless as possible and as small as possible,” though he acknowledges this change cannot happen overnight and would require a clear strategy that markets could adjust to over time.
This position concerns investors because when examining the Federal Reserve’s total assets historically, the balance sheet was relatively small before 2008 but has grown dramatically since then, trending upward aggressively despite recent modest reductions. The correlation appears clear: as the Federal Reserve bought assets, stock markets, cryptocurrency markets, and other asset classes generally rose in value. As the Fed has sold assets more recently, markets have become shakier, with investors fearing further downside if balance sheet reduction accelerates.
Raoul Pal’s Counterargument: Warsh Is More Dovish Than Perceived
Macro investor Raoul Pal has pushed back strongly against the narrative that Kevin Warsh would be bearish for markets, calling it “utter nonsense.” Pal argues that concerns about Warsh being a monetary policy “hawk” (someone who favors tighter monetary policy and higher interest rates) are based on comments Warsh made 18 years ago and don’t reflect his current stance or likely policy approach.
According to Pal’s analysis, Warsh’s job and mandate would be to implement what he calls the “Greenspan era playbook,” referring to former Fed Chairman Alan Greenspan’s approach during the 1990s technology boom. This playbook, Pal argues, means cutting interest rates and allowing the economy to “run hot,” with the assumption that productivity increases, particularly from artificial intelligence in the current era, will keep core consumer price inflation subdued, similar to how technology-driven productivity gains helped control inflation from 1995 to 2000.
Pal acknowledges that Warsh is not a fan of the large Fed balance sheet, but notes that the financial system has hit what he calls “reserve constraints,” meaning there’s a practical limit to how much the balance sheet can be reduced without causing significant problems in lending markets. Banks need sufficient reserves to function properly, and reducing the balance sheet too aggressively could “blow up the lending market.” With some banks already showing signs of stress, Pal argues Warsh won’t be able to cut the balance sheet significantly even if he wanted to.
Pal’s prediction is that Warsh would cut interest rates and “do nothing else,” essentially getting out of the way of Trump administration officials who would run liquidity through the banking system via other mechanisms. To support this view, Pal points to comments from Stanley Druckenmiller, an legendary investor who has business connections to Warsh. Druckenmiller has stated that Warsh is “very open-minded to the monetary policy approach of former Fed chief Alan Greenspan” and expressed excitement about the potential partnership between Warsh and Treasury officials, suggesting Warsh probably wouldn’t stand in the way of plans to run the economy hot through expansionary fiscal and monetary policy.
Running the economy hot means prioritizing growth and employment over inflation concerns, which typically requires maintaining or increasing liquidity in the financial system—the opposite of aggressive balance sheet reduction. If Pal’s analysis is correct, the current market weakness based on fears of monetary tightening may be misplaced.
Liquidity Analysis: The Real Driver of Market Weakness
Pal has also provided analysis of why his previous predictions for cryptocurrency haven’t materialized as expected, attributing this to focusing on global total liquidity when U.S. liquidity specifically has been more important. He suggests that the contraction of U.S. liquidity has been driving global markets more than he initially accounted for, but maintains that “the liquidity cavalry is coming” and cryptocurrency markets just need to wait a bit longer for conditions to improve.
This liquidity framework helps explain the disconnect between improving cryptocurrency fundamentals and declining prices. Markets are forward-looking and often respond more to liquidity conditions than to fundamental developments, at least in the short to medium term. If U.S. dollar liquidity has been contracting, this would explain weakness across risk assets generally, including cryptocurrency, regardless of positive regulatory developments or adoption trends.
Investment Considerations During Market Weakness
For investors navigating this environment, historical precedent suggests that periods of maximum pessimism and extended declines often represent better long-term entry points than periods of euphoria at market peaks. While Bitcoin fell from $125,000 to the current range around $76,000, and could potentially decline further to $58,000 or even $40,000 if following historical bear market patterns, these declines create opportunities for accumulation at prices significantly below recent peaks.
The key considerations include:
- Time horizon: Short-term volatility can be extreme, but longer-term holders who accumulated during previous bear markets have historically been rewarded in subsequent bull cycles.
- Position sizing: Rather than attempting to time a perfect bottom, many experienced investors use dollar-cost averaging or set limit orders at various price levels to accumulate gradually during weakness.
- Fundamental improvements: The regulatory environment for cryptocurrency in the United States has improved significantly with new leadership at the SEC and CFTC, and the passage of supporting legislation. These developments may not prevent short-term price weakness but improve the long-term outlook.
- Liquidity conditions: Monitoring Federal Reserve policy, balance sheet trends, and broader liquidity conditions provides context for understanding whether current weakness is likely temporary or represents a longer-term shift.
- Risk management: Using limit orders on reputable exchanges allows investors to execute purchases at specific price targets rather than making emotional decisions during volatile periods.
The cryptocurrency market remains in a challenging period, caught between improving fundamentals and uncertain monetary policy. Whether Bitcoin tests $40,000 or $58,000, or finds support at current levels, depends largely on factors outside cryptocurrency itself, particularly Federal Reserve policy decisions and broader liquidity conditions. Understanding these dynamics helps investors make more informed decisions rather than reacting emotionally to short-term price movements.