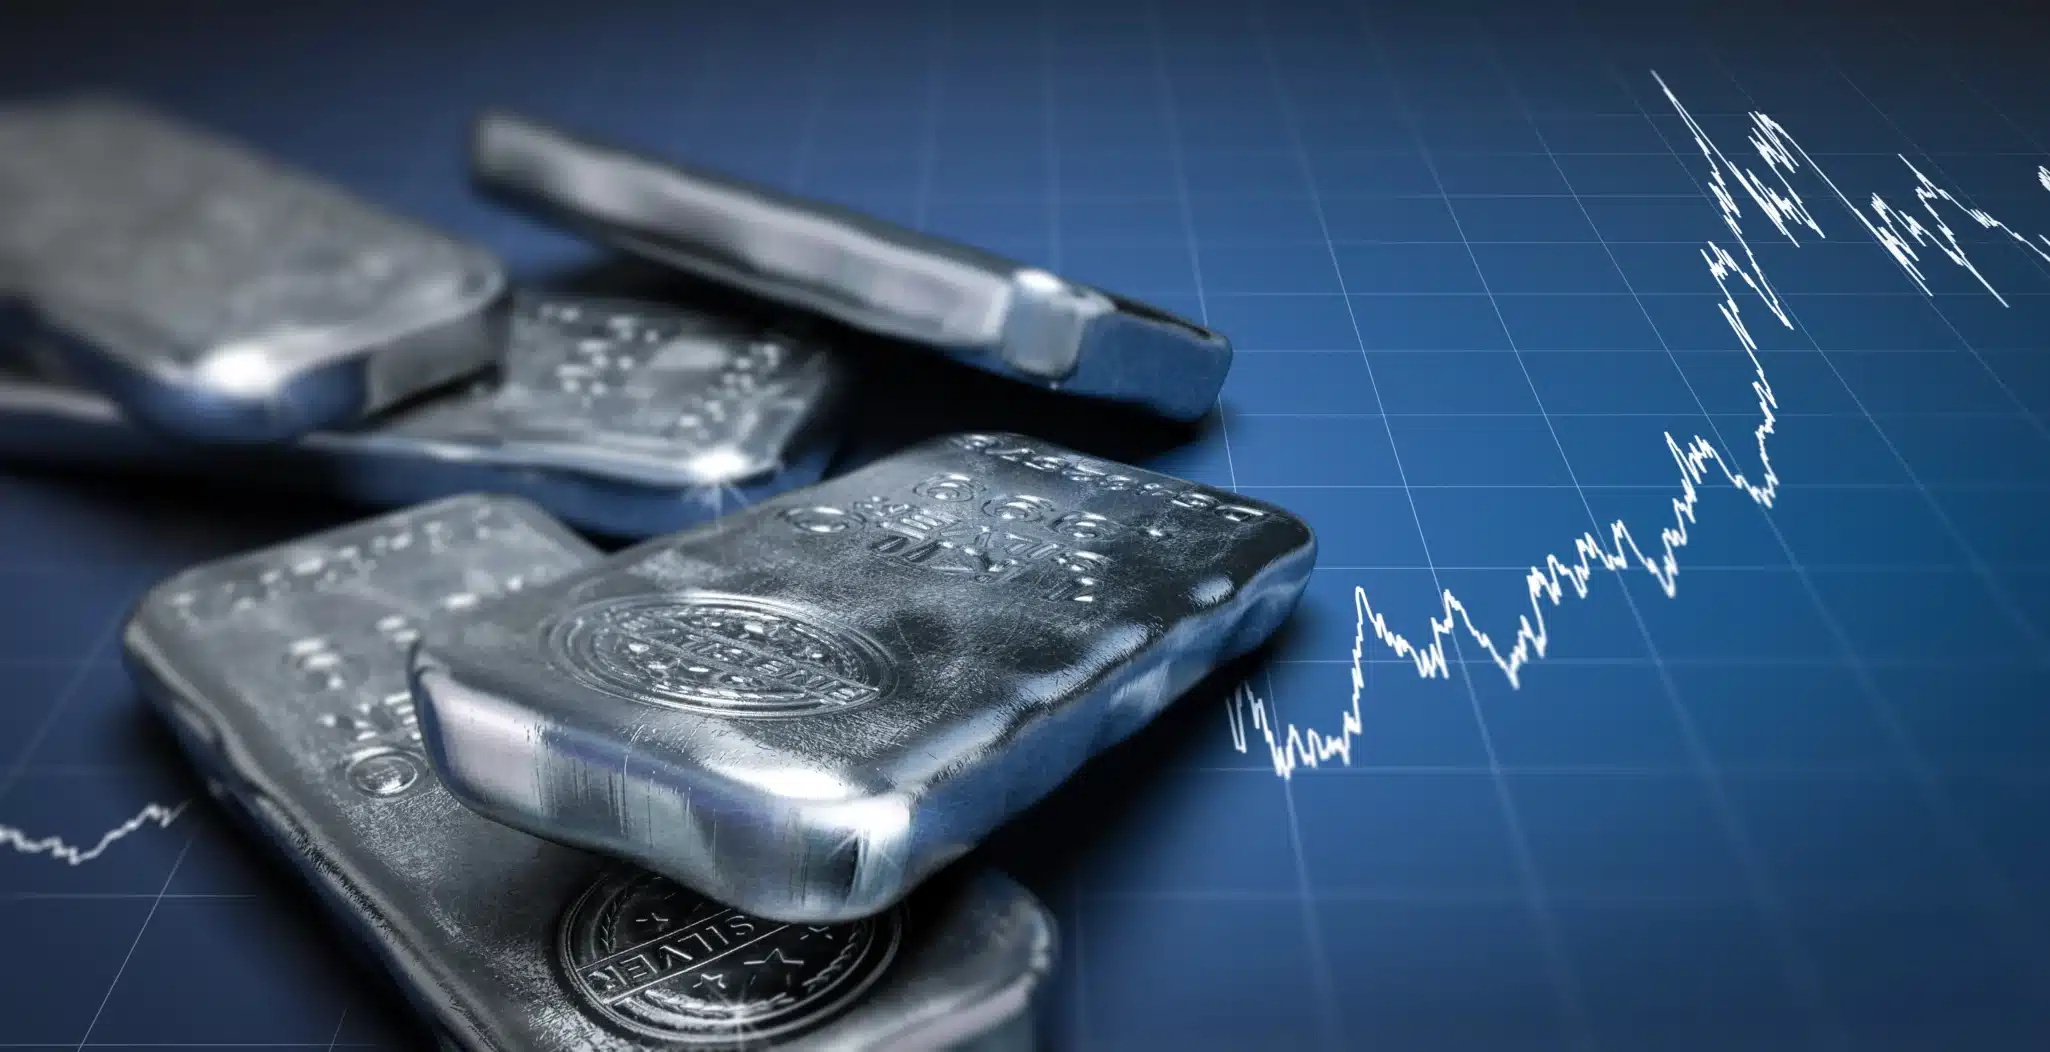
Here is a puzzle worth sitting with for a minute. The silver market is about to close out its sixth consecutive year of a supply deficit, with the Silver Institute’s World Silver Survey 2026 putting this year’s shortfall at roughly 46.3 million ounces, wider than last year’s 40.3 million ounce gap. Add it up since 2021 and the cumulative drawdown from above ground stockpiles tops 762 million ounces. And yet silver is trading around $55 to $58 an ounce today, down sharply from the more than $121 an ounce it touched at its all time high in early 2026. A market can’t seem to produce enough of the metal to meet demand, has been drawing down inventories for half a decade, and the price still got cut by more than half. What is going on?
The short answer is that fundamentals and price action are running on different clocks. Structural deficits build slowly, over years, while price is set minute by minute by whoever is willing to buy or sell futures contracts on a given afternoon. Early 2026 saw a genuine liquidity squeeze in physical silver, driven by exchange outflows and heavy Indian buying, that pushed prices to records almost overnight. What has followed since is a normal, if painful, unwind of that speculative excess, layered on top of shifting expectations for Federal Reserve policy. None of that erases the deficit. It just means the deficit isn’t the only thing moving the tape right now.
The Deficit Nobody Is Fixing
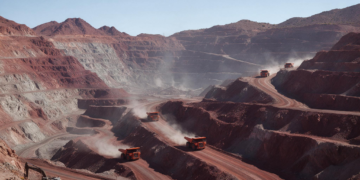
Start with why the shortfall exists in the first place, because it isn’t a mystery, it’s arithmetic. The Silver Institute’s numbers show total 2026 supply landing around 1,066.4 million ounces against total demand of about 1,112.6 million ounces. Mine production, expected at 844.1 million ounces this year, is essentially flat and has actually been drifting lower over the past decade. Back in 2016, global mine output stood near 900 million ounces. A decade of declining ore grades, longer permitting timelines, and the sheer expense of bringing new mines online has whittled that down, not up, even as prices have risen.
Here is the part that trips up a lot of investors who assume silver behaves like gold. It doesn’t, because roughly three quarters of mined silver isn’t the primary target of the mine at all. It comes out as a byproduct of digging for copper, lead, and zinc. That means silver output doesn’t really respond to silver’s own price. A copper mine expands or contracts based on copper economics, and whatever silver rides along with it is almost incidental. So even when silver prices rally hard, as they did through 2025, the supply response that would normally cool off a hot market barely shows up. Recycling helps at the margin, expected to climb about 7% this year to 211.3 million ounces, its highest level since 2012, but that still covers less than a fifth of total demand.
On the demand side, industrial fabrication remains the single largest bucket, projected at around 639.6 million ounces this year, a bit lower than 2025 as solar panel silver loadings have eased. But that softness is being offset by silver’s growing footprint in artificial intelligence infrastructure, aerospace, and advanced electronics, all of which need the metal’s conductivity and reflectivity in ways nothing else quite matches. Layer on physical investment demand, expected to jump around 18% to 257.6 million ounces as coin and bar buying accelerates, and you get a market where even a modest drop in overall consumption still leaves supply well short.
Why the Price Cracked Anyway
So if the deficit is real and getting worse, why did silver fall by more than half from its peak? Part of the answer is that the January spike was itself unusual. Late in 2025, the London market, which handles the bulk of short term lending and spot trading in silver, saw an outflow of around 225 million ounces between December 2024 and October 2025, much of it relocating to CME vaults in the United States. Physically backed exchange traded products had tied up as much as 83% of the silver that remained accessible, leaving very little free float to absorb a sudden wave of buying. When Indian demand surged into that thin market, short sellers were forced to cover, and the resulting scramble pushed prices to levels that had little to do with any single year’s supply and demand balance and everything to do with a liquidity crunch.
Liquidity crunches, by their nature, resolve. Inventories get relocated, positions get unwound, and prices that spiked on scarcity of available metal in one specific location come back down even if the underlying deficit hasn’t budged an inch. That is roughly what has played out since. Add in a market that spent much of mid-2026 recalibrating how aggressively the Federal Reserve will move on rates, and you have plenty of reason for a sharp pullback that isn’t really a referendum on silver’s long term supply picture at all.
The Government Took Notice
One development from late last year is worth flagging because it changes the policy backdrop going forward. In November 2025, the federal government added silver to the U.S. Critical Minerals List, a formal acknowledgment of the metal’s role in national security, supply chain resilience, and advanced technology and infrastructure. That designation matters because the United States is a heavy net importer of silver. Domestic recycling covers only a small fraction of consumption, with the large majority sourced from abroad. A critical minerals designation tends to open the door to policy tools that weren’t previously on the table, from permitting support for domestic projects to trade measures aimed at securing supply chains, the kind of thing we have already watched play out with copper this year as Washington adjusted Section 232 tariffs and added new smelt and cast reporting requirements for importers.
What This Actually Means Going Forward
None of this is a prediction that silver prices are about to do anything in particular over the next month or quarter. Prices move on sentiment, positioning, and macro data in the short run, and nobody has a reliable model for calling those swings. What the deficit data does tell you is something slower and arguably more useful, which is that the structural cushion in the silver market keeps getting thinner. Six straight years of drawing down above ground stockpiles doesn’t mean the world runs out of silver. It means the market has progressively less spare capacity to absorb a demand shock without a disproportionate price reaction, which is exactly what happened in the run-up to January’s spike.
Analysts at Metals Focus, who compile the Silver Institute’s data, have said a return to sustained surplus would require an unusually extreme combination of rising supply and falling demand happening at the same time. Given how slowly new mine supply comes online and how entrenched industrial demand from electrification and data center buildouts has become, that combination doesn’t look imminent. Investors weighing exposure to silver, whether through physical metal, mining equities, or royalty and streaming companies with silver exposure, are ultimately making a bet on how that supply and demand gap evolves over years, not on where the spot price sits on any given Tuesday. The deficit is the slow moving story. The price chart is the noisy one. It pays to know which one you’re actually trying to read.
____________________________________________________________________________________________________
This article is written for educational and informational purposes only and does not constitute financial or legal advice. The views and analytical frameworks presented draw on publicly available information and reported commentary from industry participants. Readers are encouraged to consult primary sources and form their own informed views on these complex topics.